
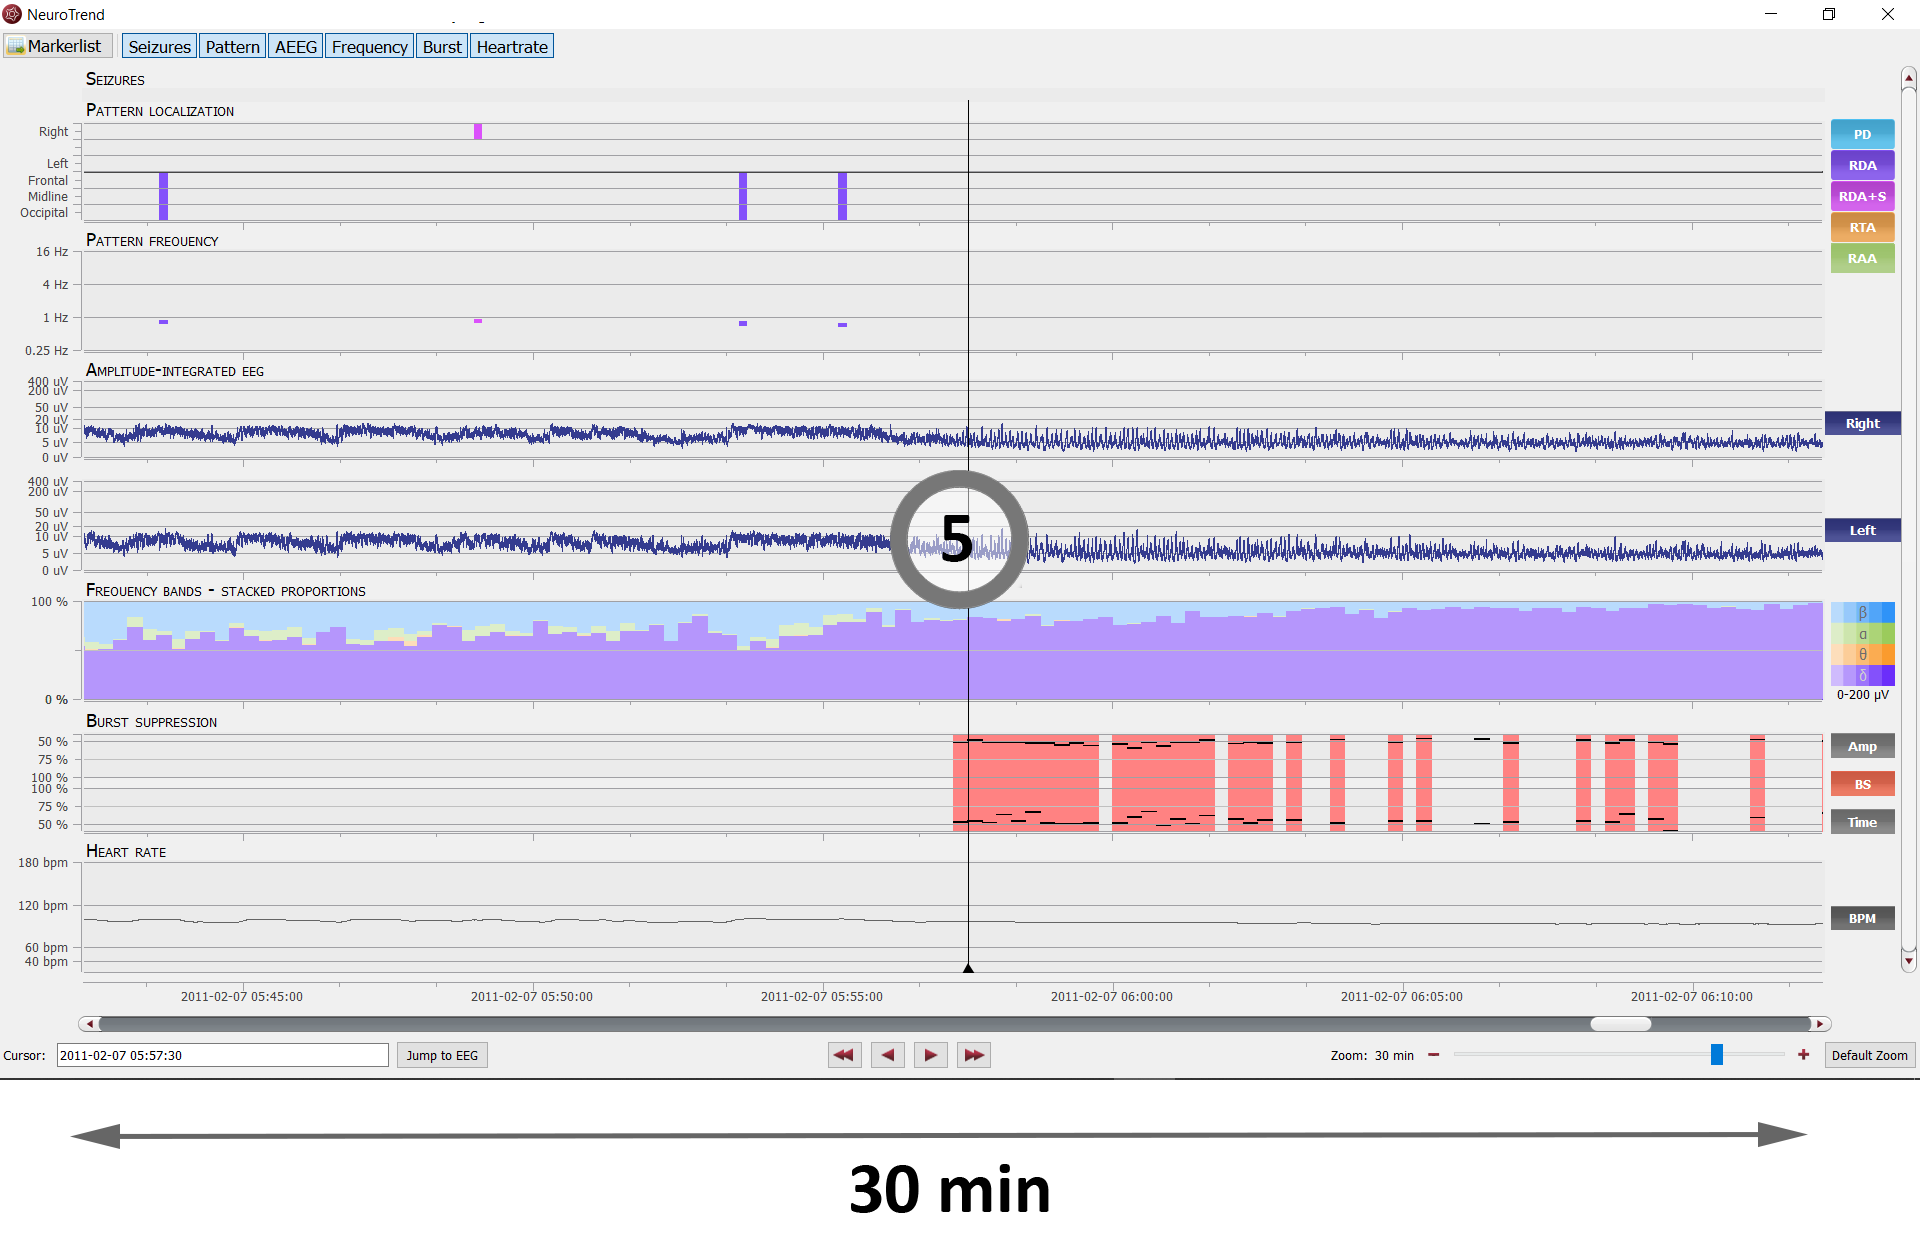
In this three-hour-long recording, encevis detects several seizures, rhythmic and periodic patterns as well as burst suppression. Repeated seizures occur and show similar patterns every time. Several timepoints have been picked out for you to see the corresponding EEG.

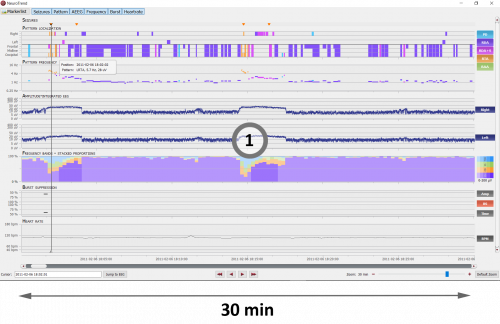
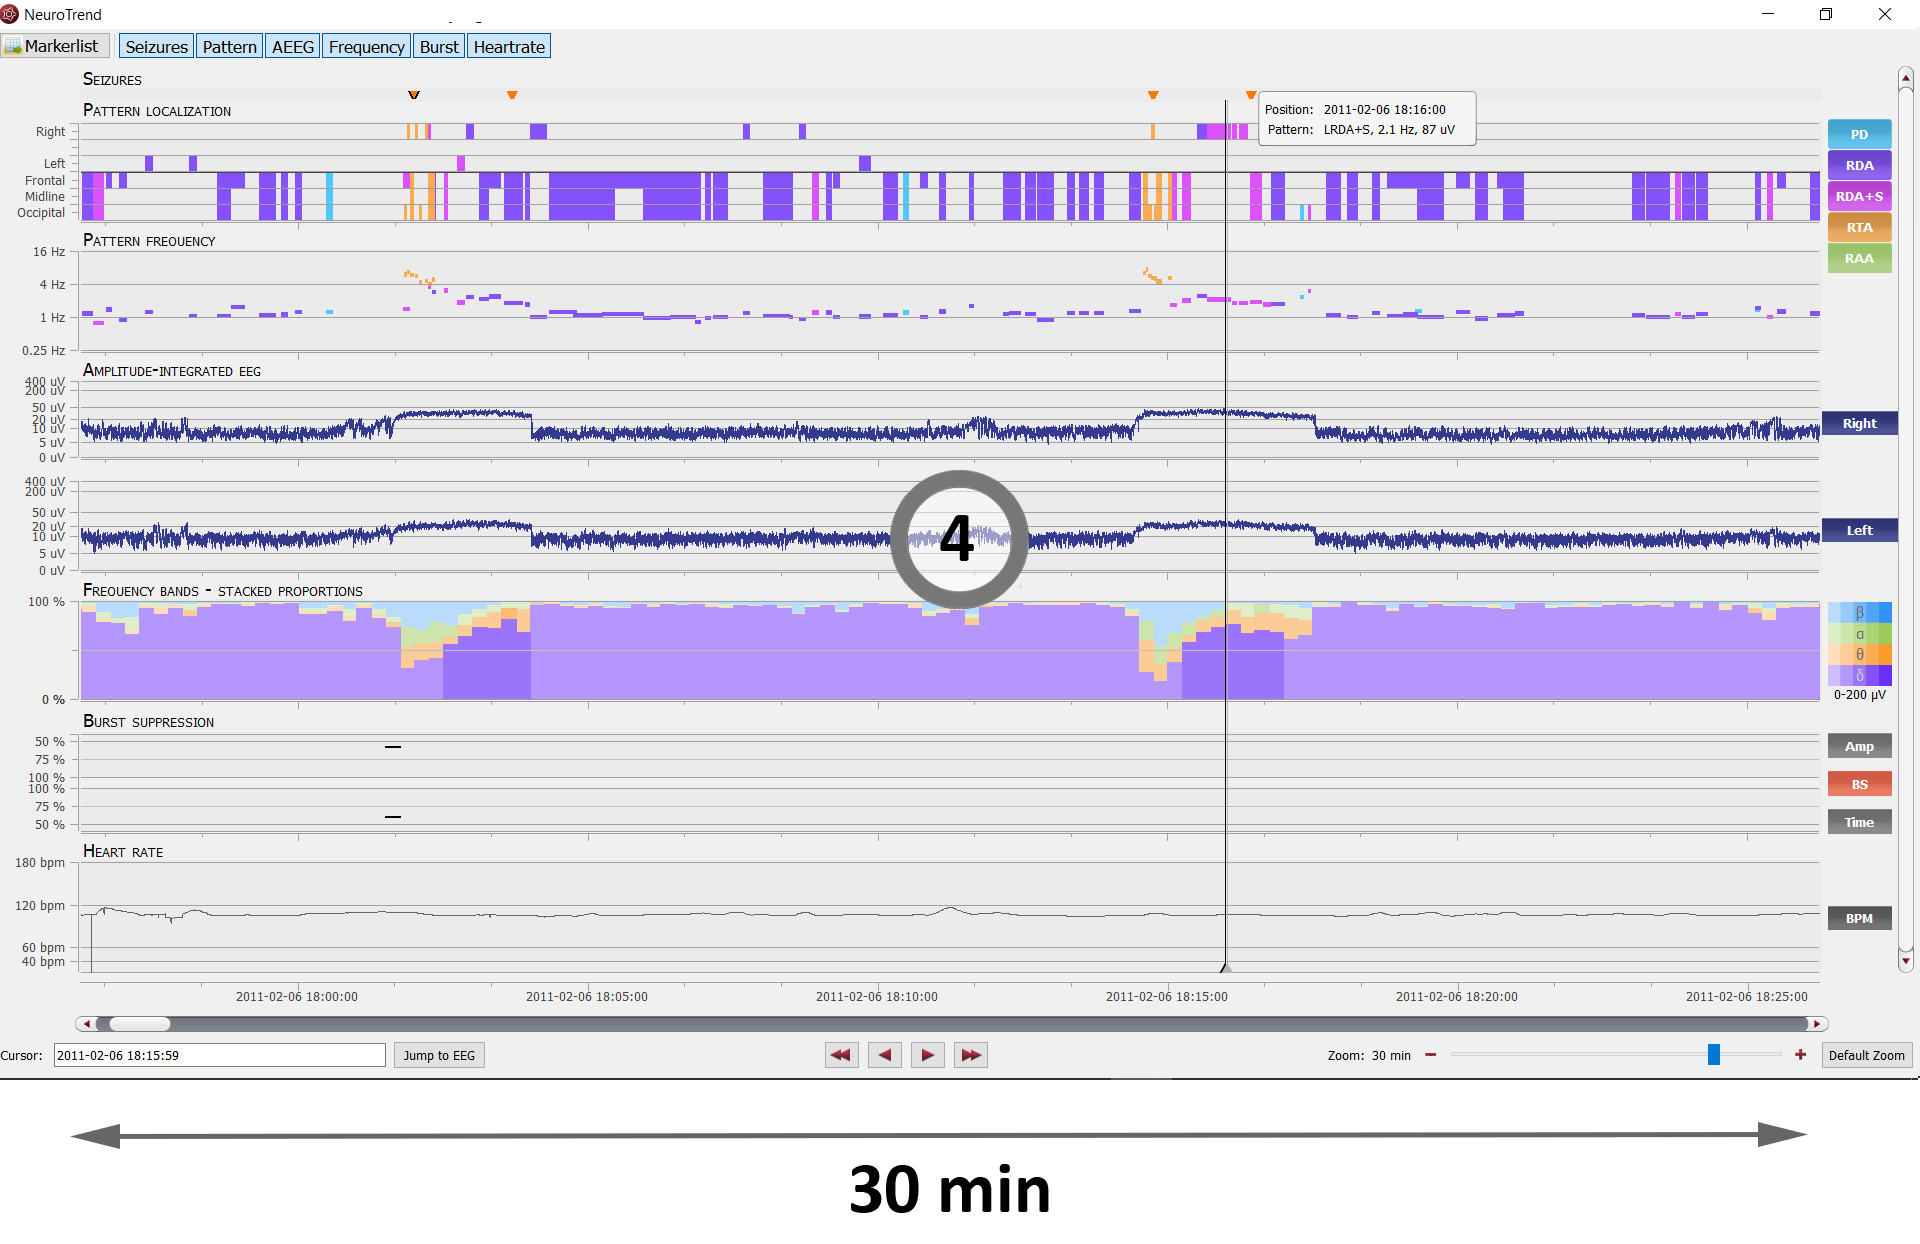
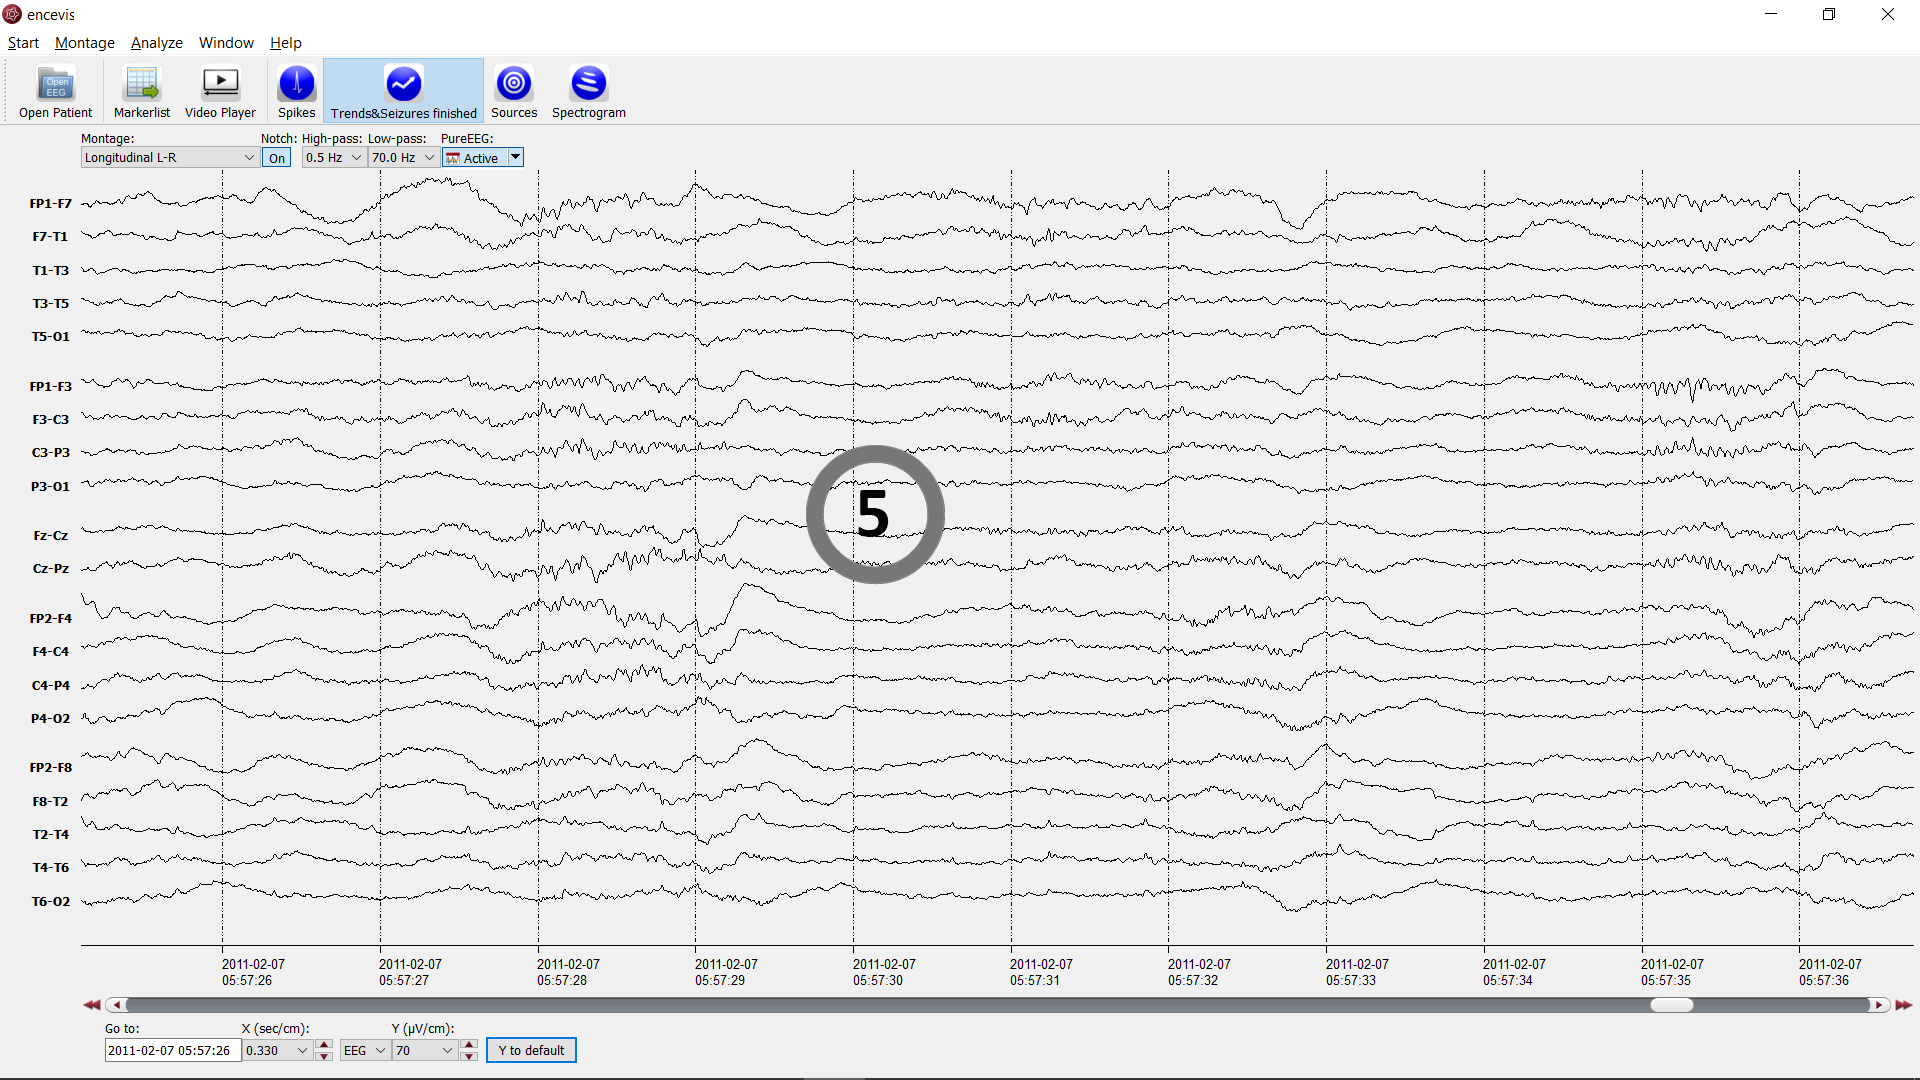
Here the beginning of a seizure is marked. It is indicated by the little triangle in the trace “SEIZURES”. encevis finds rhythmic theta activity at this timepoint, which is marked by yellow lines in the traces “PATTERN LOCALIZATION” and "PATTERN FREQUENCY". Observe how these yellow lines go down over time as the frequency is decreasing. The values of the frequency and average voltage can be seen when you move the cursor over the trace. In this case 5.7Hz and 28uV.
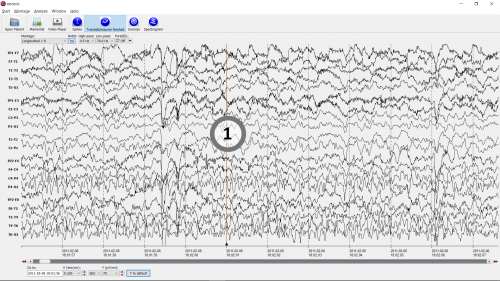

The rhythmic activity decreases in frequency and encevis detects rhythmic delta activity. This is visualized by purple lines in the trace "PATTERN". The traces "PATTERN FREQUENCY" and "FREQUENCY DISTRIBUTION" show that the EEG is slowing down. encevis seizure detection shows another marker as the seizure is continuing.
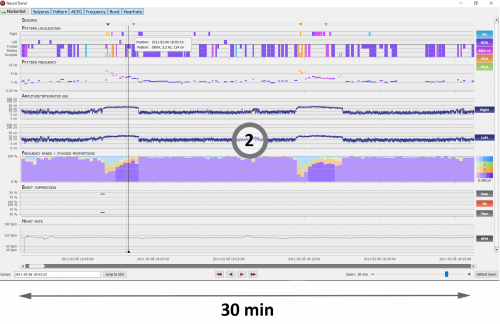
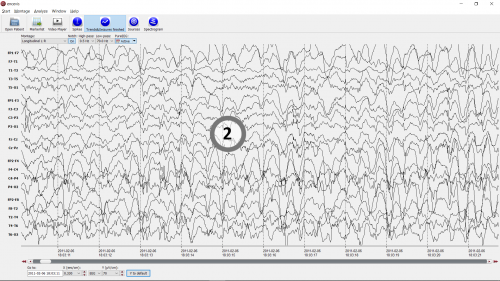

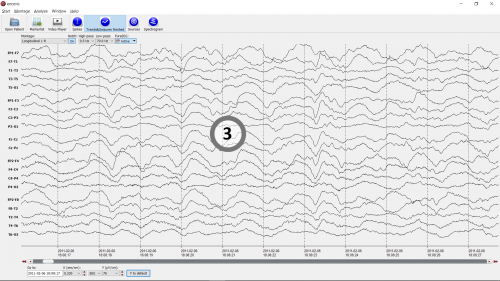
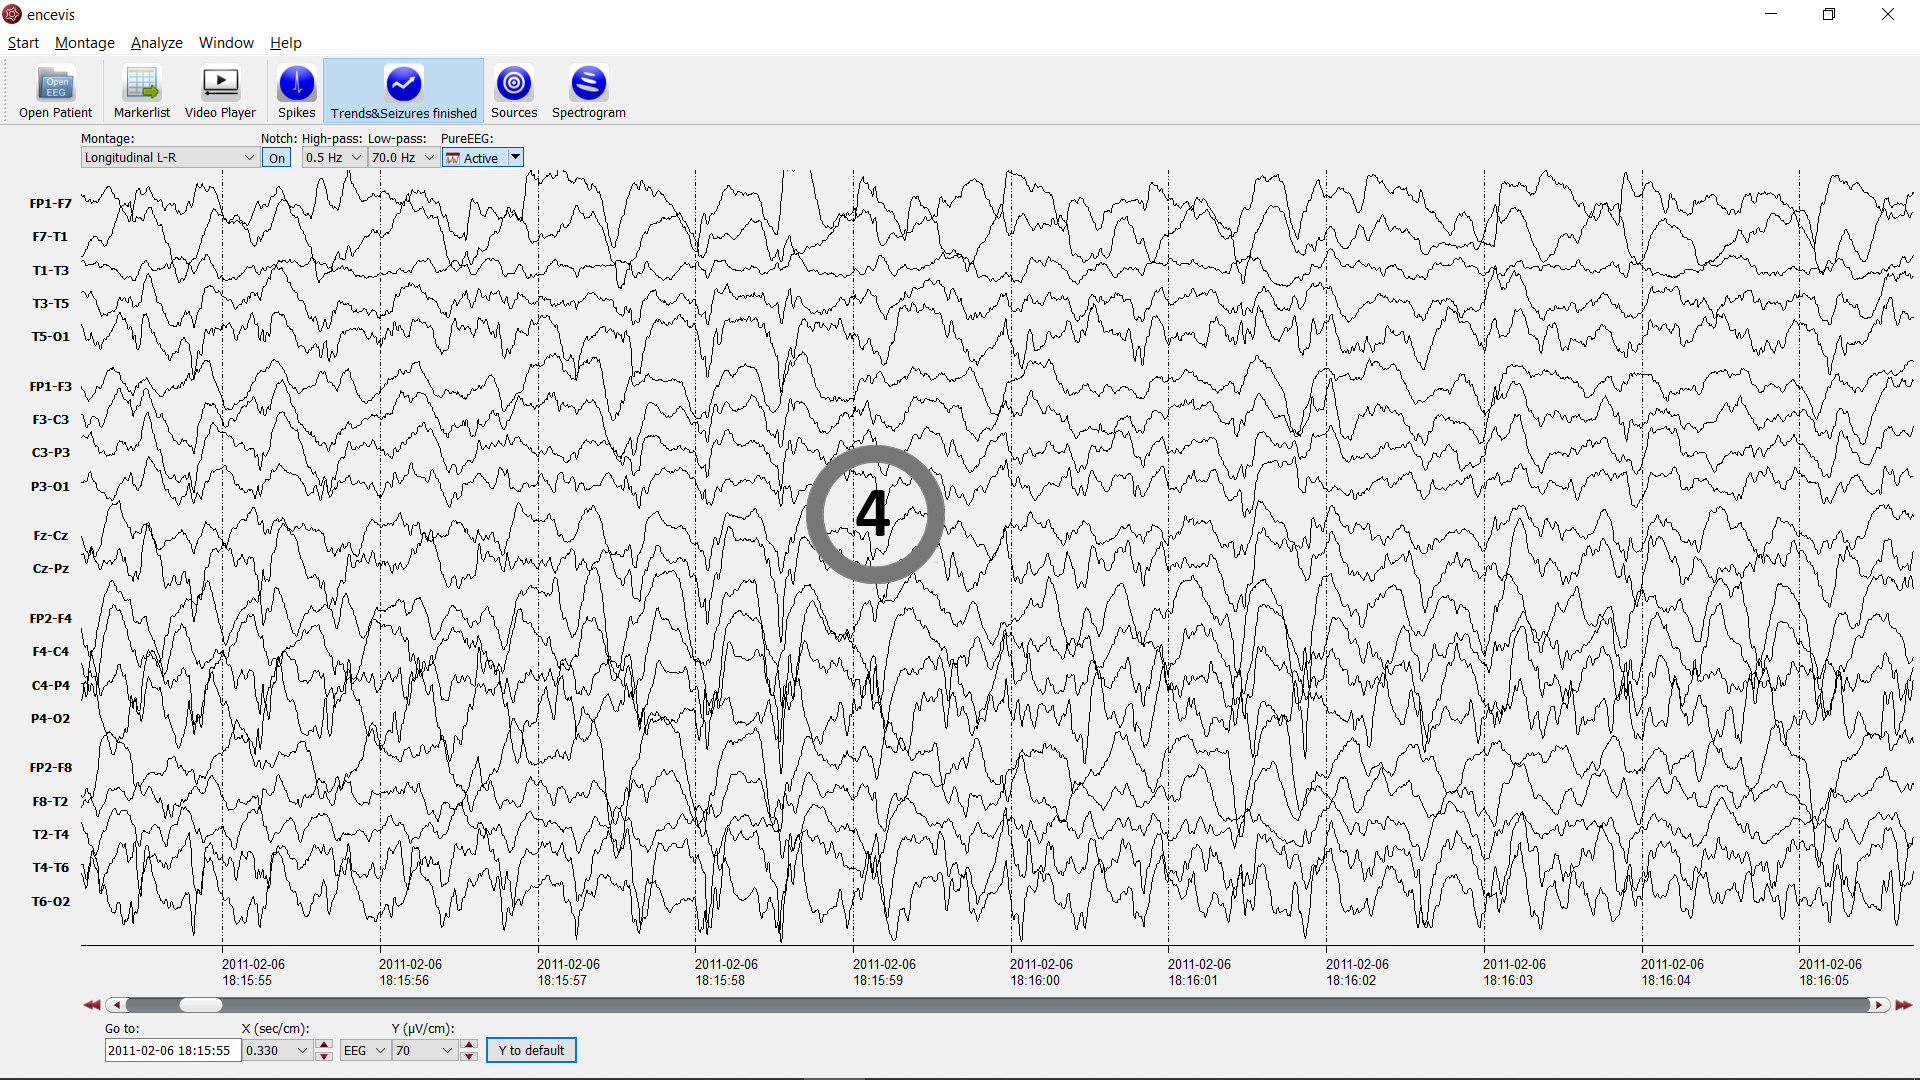
encevis still detects rhythmic delta activity shown as purple lines in the traces "PATTERN LOCALIZATION" and "PATTERN FREQUENCY". The rhythmic delta activity has lower frequency and amplitude at this timepoint, which can also be seen in the trace "AMPLITUDE-INTEGRATED EEG".
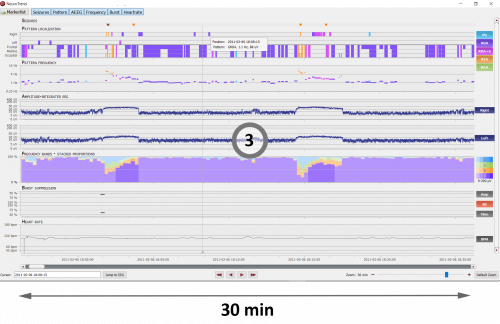

Repeated seizures occur every 15min and are detected by encevis. Patterns with similar frequencies are detected and you can notice a similar evolution every time. Here, encevis detected also RDA+S, rhythmic activity with superimposed spikes. Note in the 3h view above, that there are 10 such seizures.

In this part, no more seizures or rhythmic patterns are detected. Instead you can see red lines and black dots in the trace "BURST SUPPRESSION" showing that burst suppressions were detected.
Find more detailed information about the methods behind the detection of patterns in the publication "Automatic detection of rhythmic and periodic patterns in critical care EEG". The methods for the detection of burst suppression can be found in the publication "Monitoring burst suppression in critically ill patients: Multi-centric evaluation of a novel method". The detections implemented in encevis follow the standard of the ACNS for critical care EEG.
By moving the cursor to the timepoint that interests you, the exact values of the calculated features are shown. By using the mouse wheel you can easily zoom in and see the detections in more detail. You can quickly switch from 24 hours to seeing 5 min of results. Find more information in the tutorial videos.
Are you interested in a trial version?