
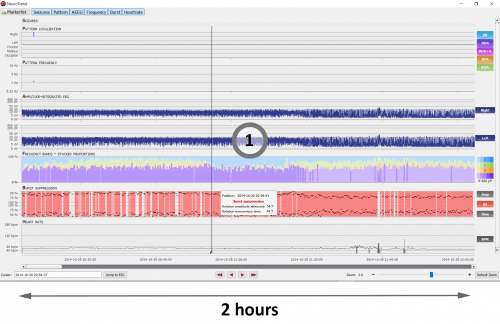
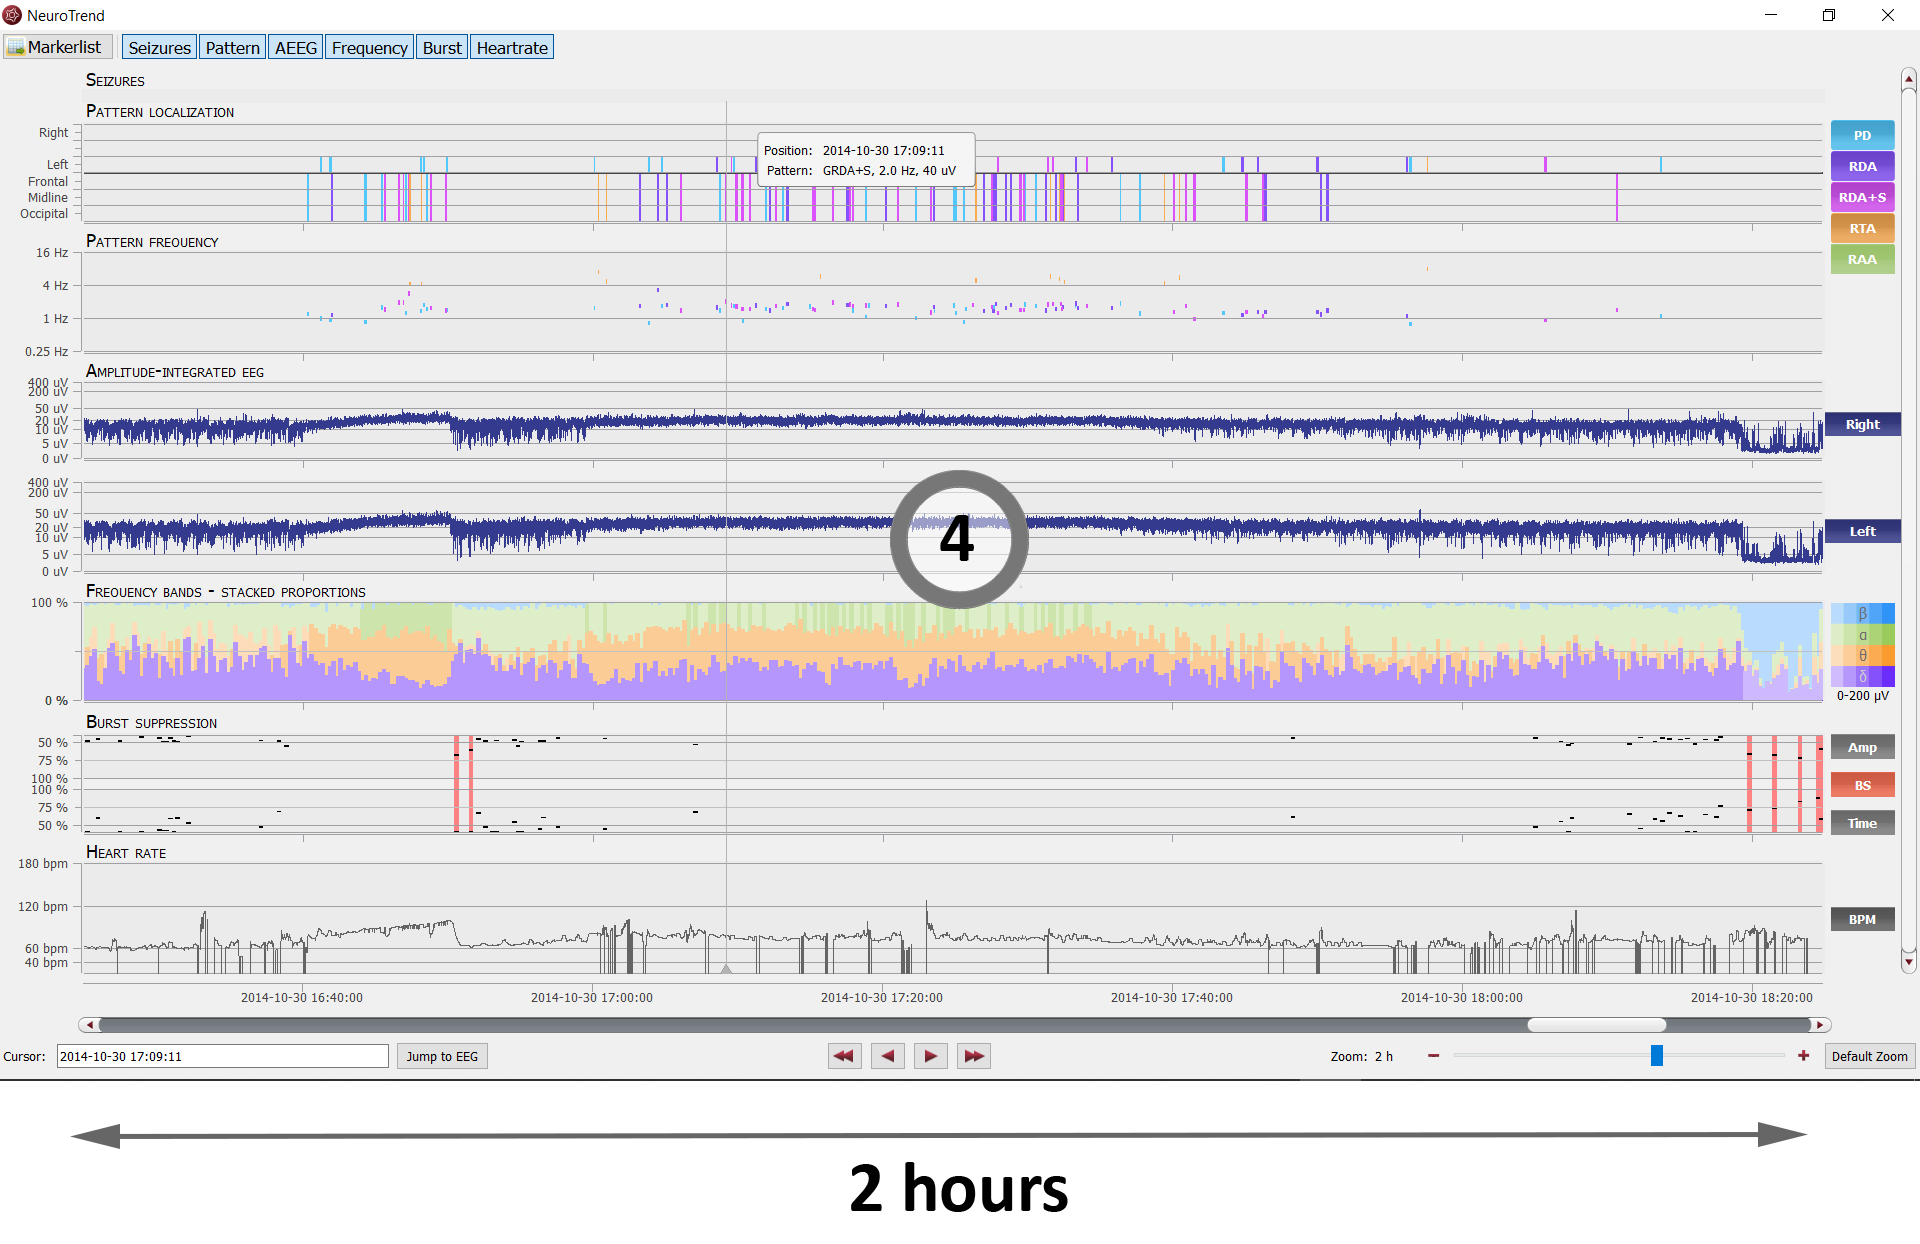
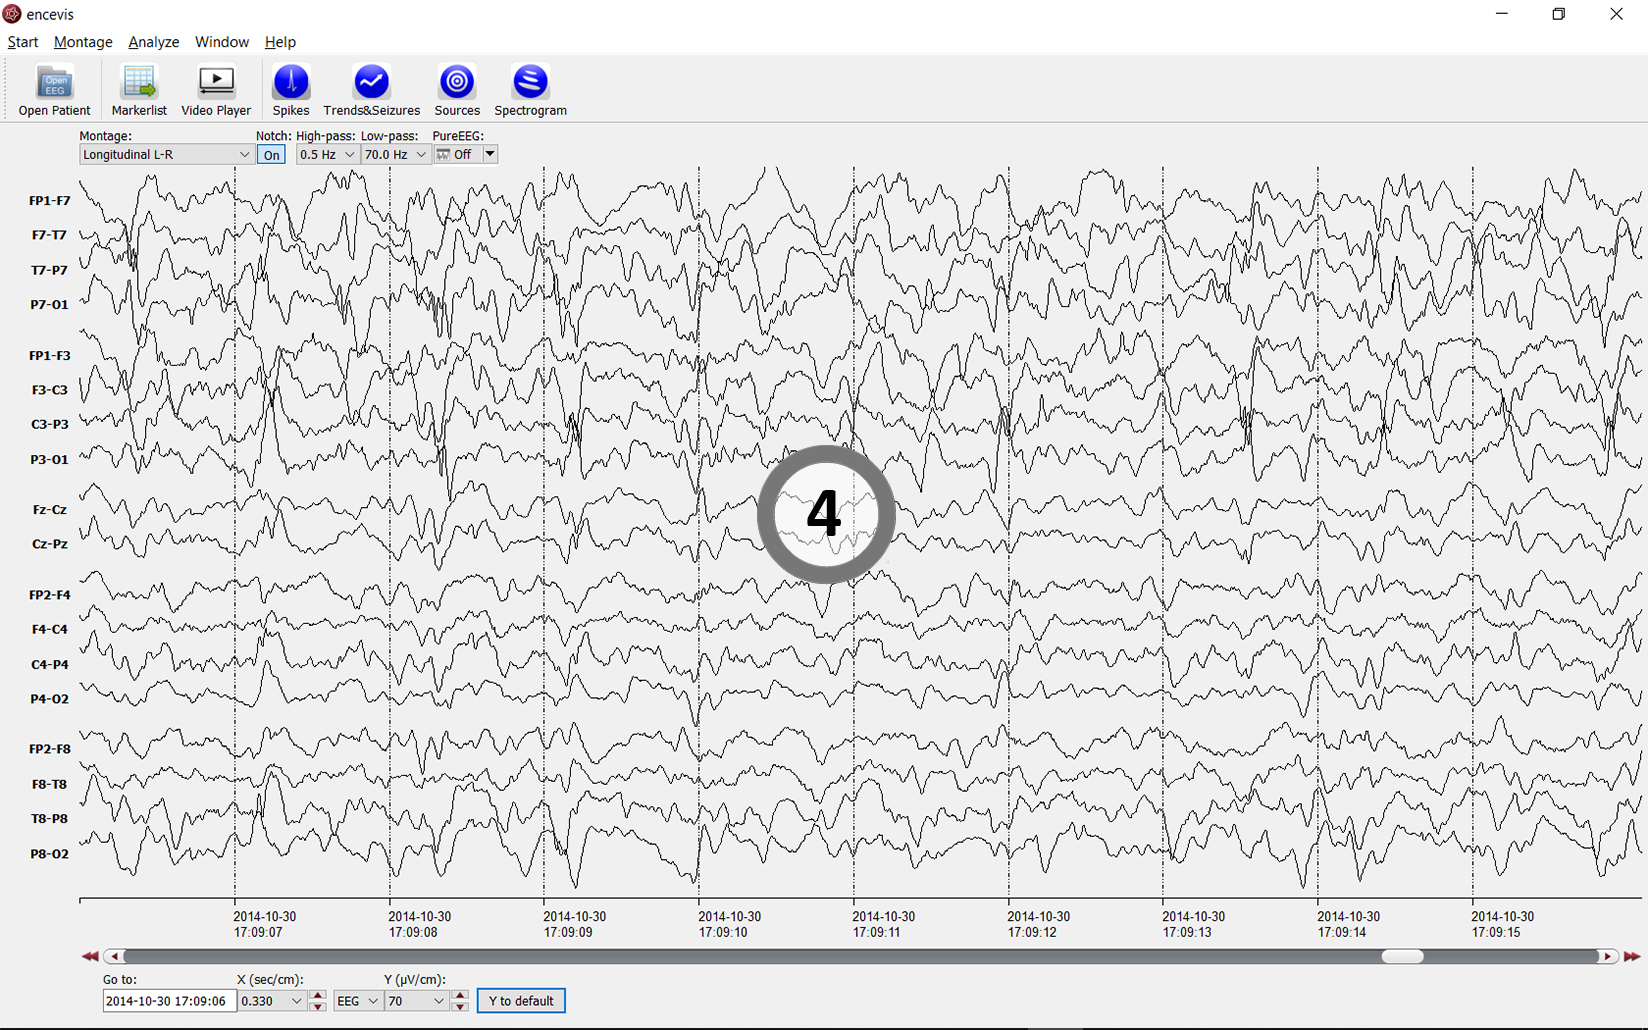
Here encevis NeuroTrend shows an analysis of 24 hours of continuous monitoring. Despite the long time period, several phases and trends can be easily identified. We selected four time points and zoomed in, for you too see the results in more detail with the corresponding EEG.

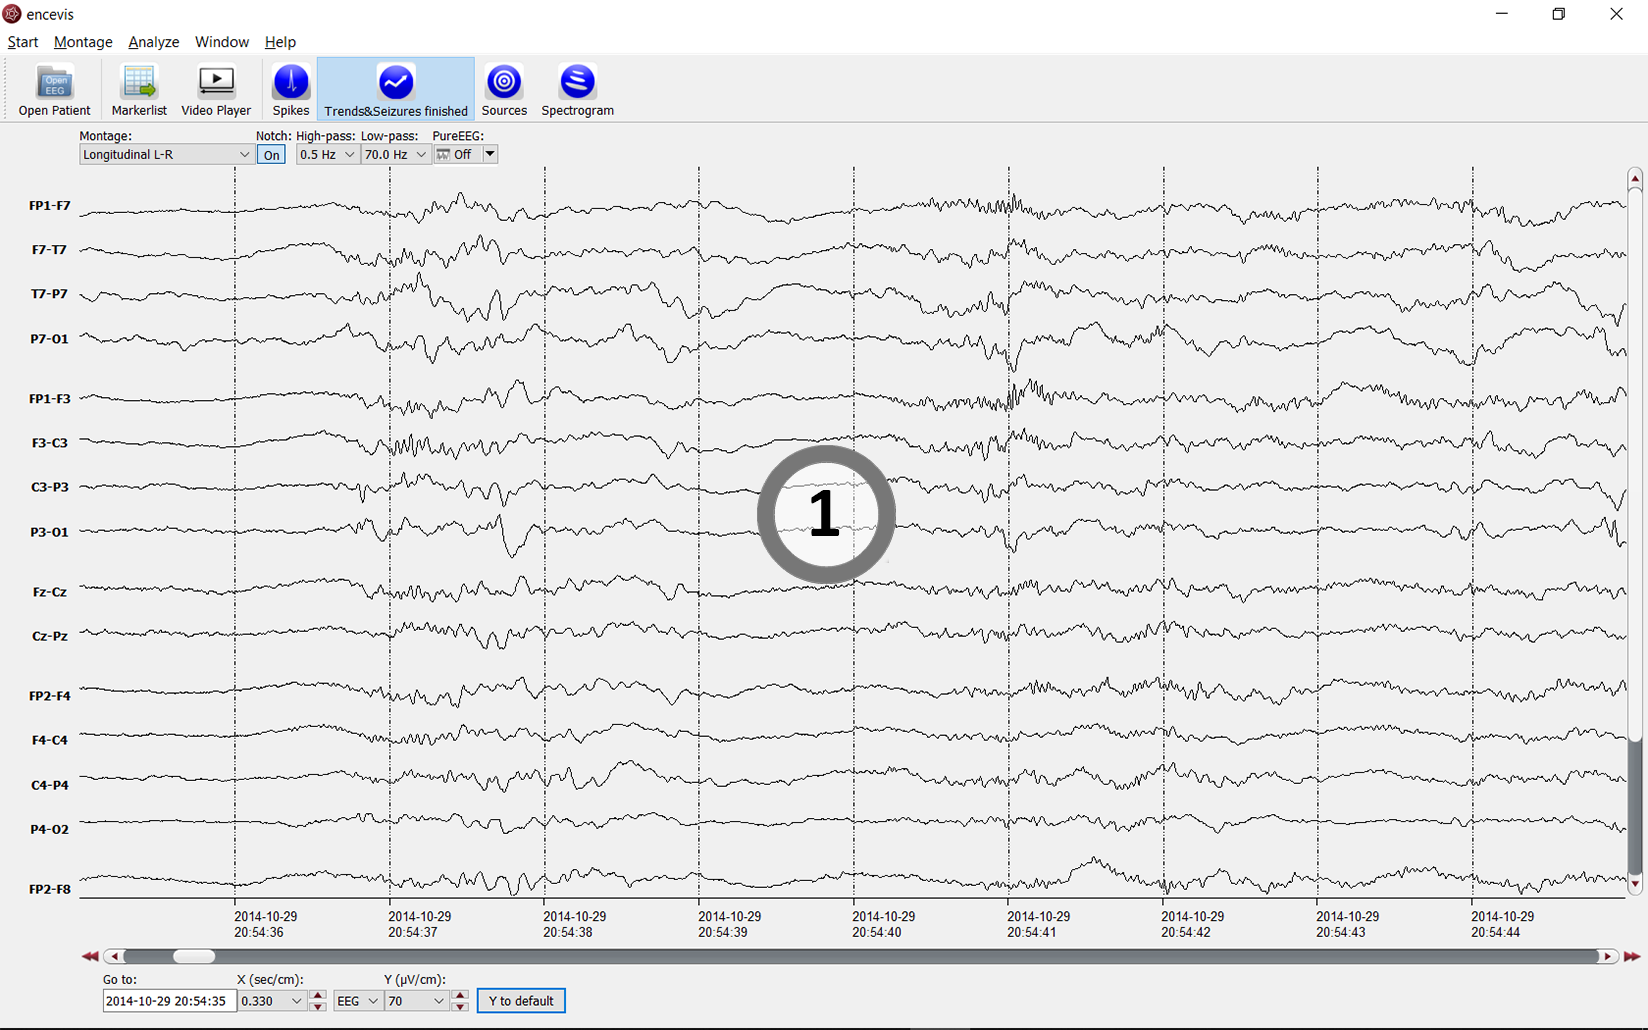
In the first phase, from 8PM to 2PM on the following day, the information lies mainly in the trace "BURST SUPPRESSION". The red lines mean that burst suppression was detected. The patient is under sedation. The black dots behind the red lines represent the values of the relative amplitude attenuation, above, and the relative suppression time, below. At this timepoint, the amplitude attenuation is of 54% and the relative suppression time 44% (see corresponding EEG below).

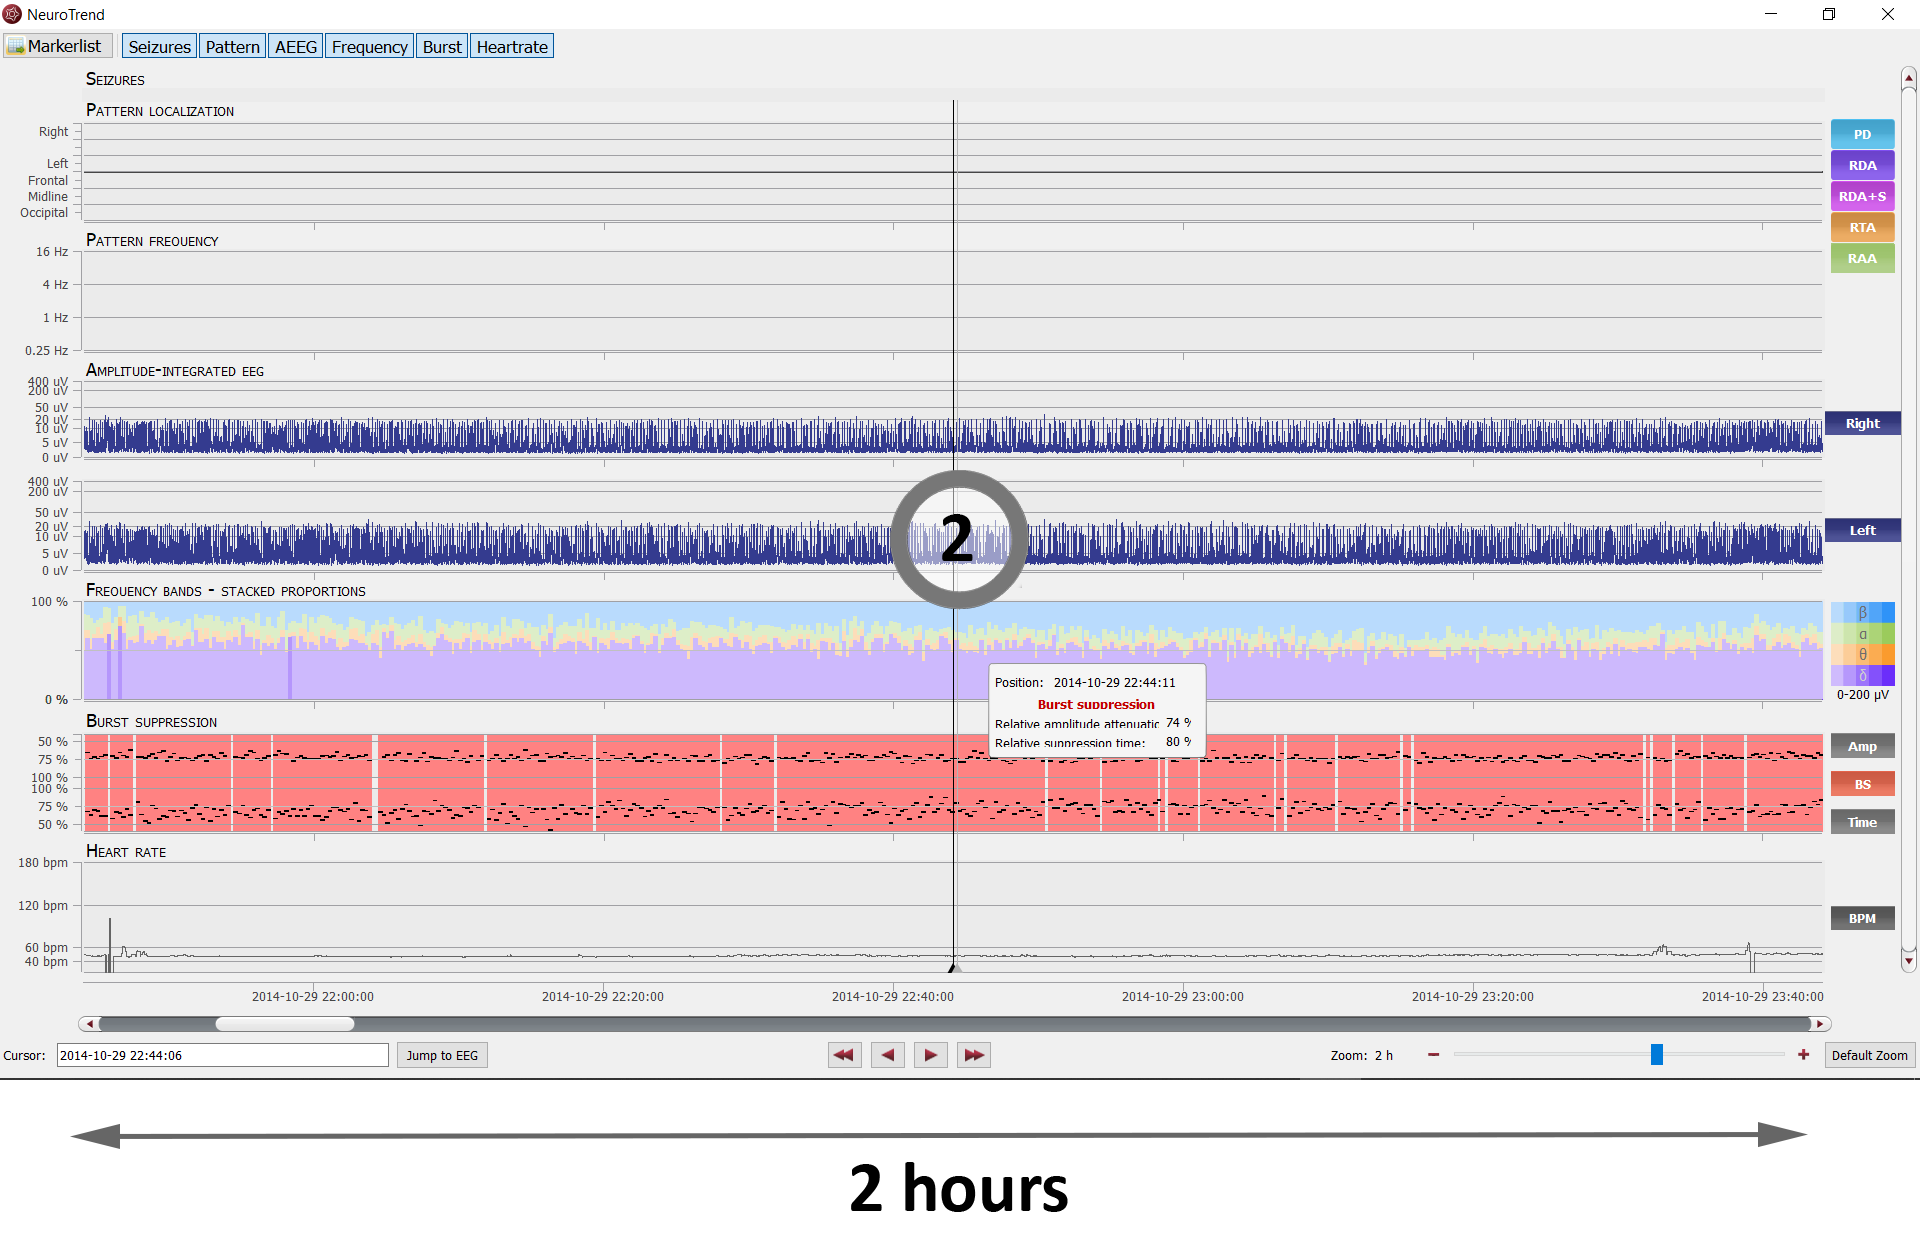
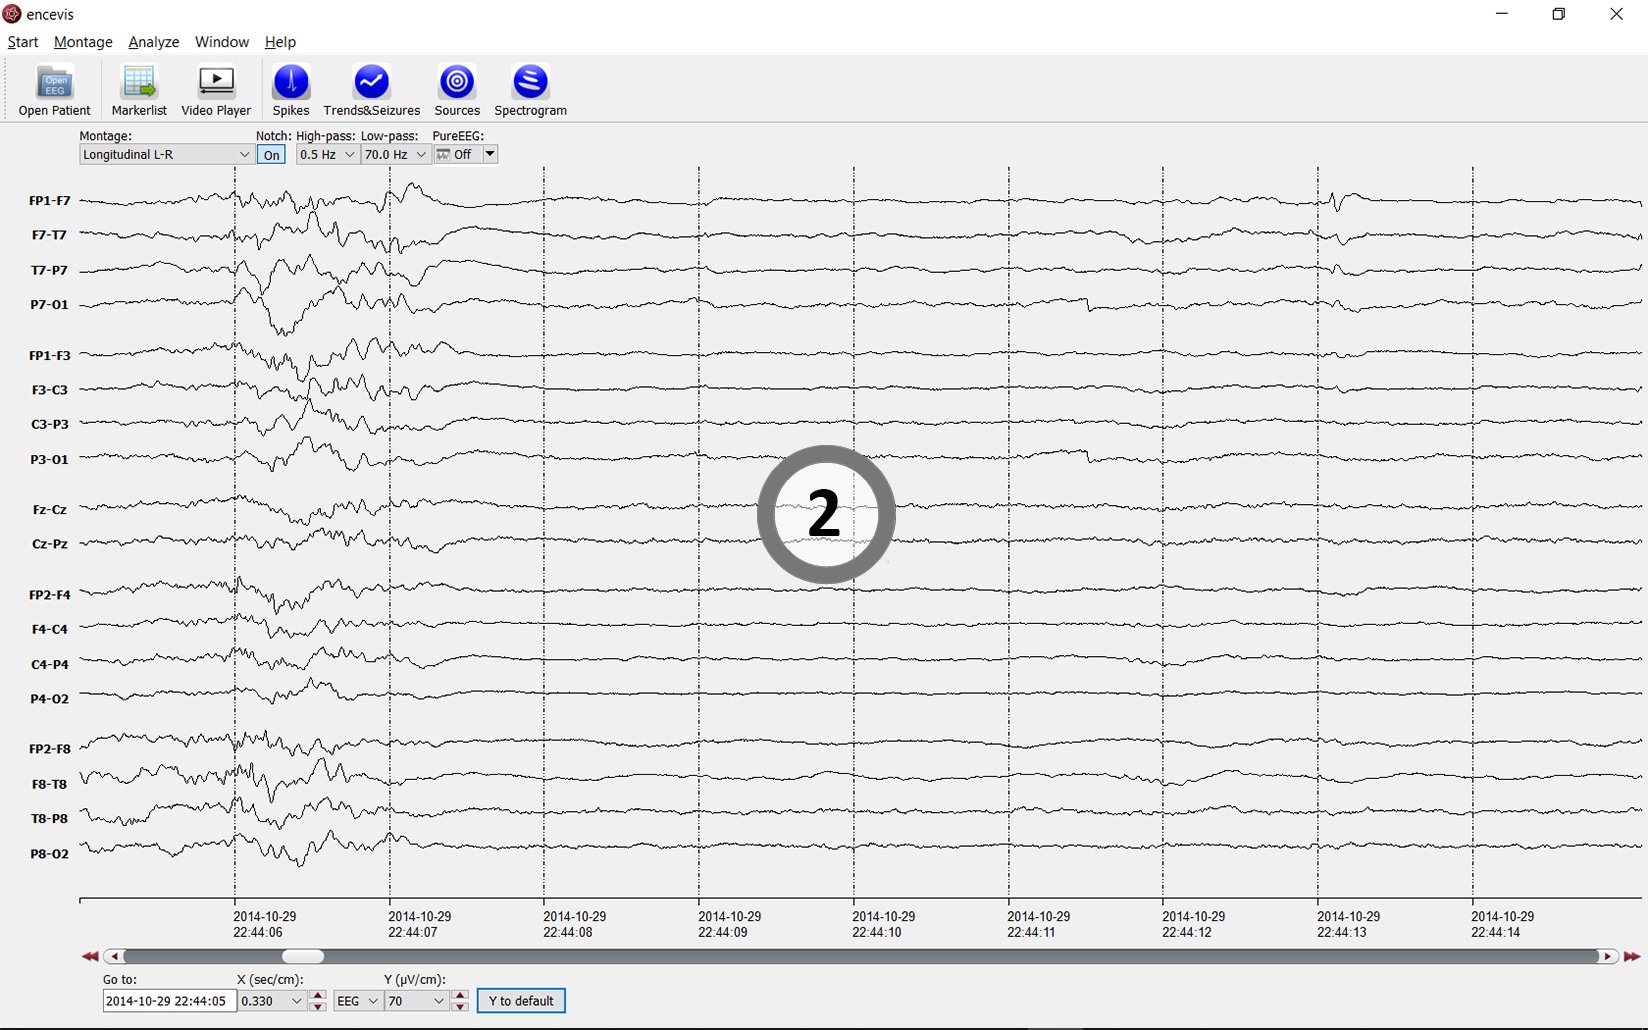
At this timepoint the relative amplitude attenuation increased to 74% and the relative suppression time increased to 80%. Note that burst suppression can also be seen in the trace "AMPLITUDE-INTEGRATED EEG". In the following, burst suppression is detected for a longer period, until the attenuation starts decreasing and finally no burst suppression is detected any longer.

In this part of the recording, the attention is drawn to the first traces "PATTERN LOCALIZATION" and "PATTERN FREQUENCY". There, the light blue lines show that periodic discharges were detected (see corresponding EEG below).


In this part of the recording, encevis rhythmic delta activity, RDA, as can be seen from the purple lines in the traces "PATTERN LOCALIZATION" and "PATTERN FREQUENCY".
Find more detailed information about the methods behind the detection of burst suppression in the publication "Monitoring burst suppression in critically ill patients: Multi-centric evaluation of a novel method". The methods behind the detection of patterns can be found in the publication "Automatic detection of rhythmic and periodic patterns in critical care EEG". The detections implemented in encevis follow the standard of the ACNS for critical care EEG.
By moving the cursor to the timepoint that interests you, the exact values of the calculated features are shown. By using the mouse wheel you can easily zoom in and see the detections in more detail. You can quickly switch from 24 hours to seeing 5 min of results. Find more information in the tutorial videos.
Are you interested in a trial version?